
python ANOVA & tukeyhsd

先要了解两个概念:
Null Hypothesis – There is no significant difference among the groups
Alternate Hypothesis – There is a significant difference among the groups
Null Hypothesis 也简称为 H0
ANOVA (one- and two-way) assumes that all the groups are sampled from populations that follow a Gaussian distribution, and that all these populations have the same standard deviation, even if the means differ.
数据集采用 bottle.csv
分析的两个字段为:
# R_O2Sat: Reported Oxygen Saturation (percent)
# Depthm: Depth in meters (meters)
先用 pd.to_numeric 把这两个字段转为 numeric 并 drop na
再把 Depthm qcut 成五组,哦,四组吧,这样它就变成 categorical 类型的了。
使用 value_counts 可以看到每组内的样本数:
Second Quarter    180694
First Quarter     167191
Last Quarter      166500
Third Quarter     152063
Name: Depthm, dtype: int64
sns box plot 看下分布情况:

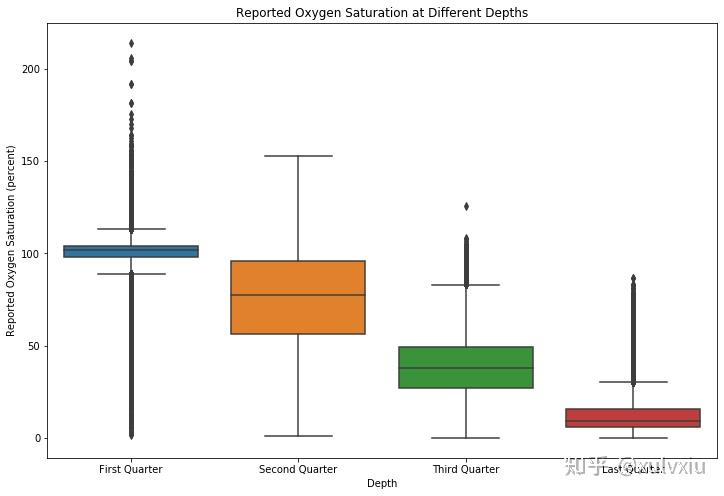
从上图可以看出,我们把Depth分了4个组,如果把每一个组里面 R_O2Sat 的均值提取出来,做为4个数字,那么这4个数字之间的差别非常大。
The mean value of R_O2Sat significantly differ among depth groups.
下面搞一搞 ANOVA
model = smf.ols(formula='R_O2Sat ~ C(Depthm)', data=sub).fit()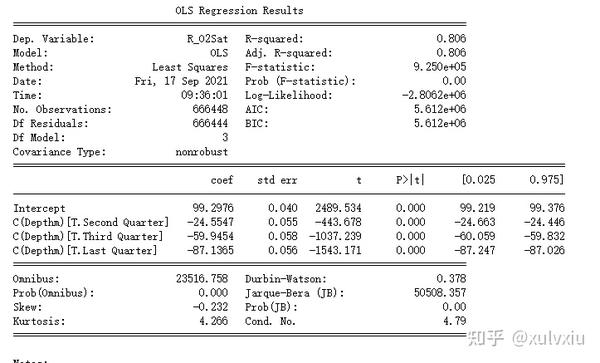
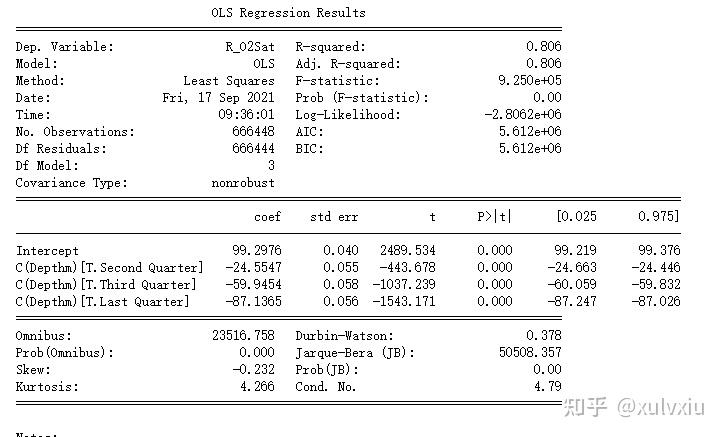
输出这么多,也就看看 Prob (F-statistic)了。
从上述输出中可以看到 Prob (F-statistic) 值为 0.00 远远小于阈值 0.05
we reject Null Hypothesis and alternative hypothesis is supported.
we can conclude that there exists an association between R_O2Sat and depth, there is a significant difference among the groups.
下面可以验证一下 ANOVA 计算的准不准。
分组求一下平均数: sub.groupby('Depthm').mean()
means for R_O2Sat by Depth
                 R_O2Sat
Depthm
First Quarter  99.297642
Second Quarter 74.742944
Third Quarter  39.352210
Last Quarter   12.161153
可以看到 与 ANOVA 计算出来的组内均值(coef)是一样的。
再看下每个组内的标准差,sub.groupby('Depthm').std()
standard deviations for R_O2Sat by Depth
                 R_O2Sat
Depthm
First Quarter  10.594757
Second Quarter 22.869652
Third Quarter  18.165061
Last Quarter    9.108701
可以认为每组内的标准差还算是比较接近。
最后再用 tukeyhsd 验证一下:
mc = multi.MultiComparison(sub['R_O2Sat'], sub['Depthm'])
res = mc.tukeyhsd()
输出:
         Multiple Comparison of Means - Tukey HSD, FWER=0.05
=====================================================================
    group1         group2     meandiff p-adj  lower    upper   reject
---------------------------------------------------------------------
 First Quarter   Last Quarter -87.1365 0.001 -87.2816 -86.9914   True
 First Quarter Second Quarter -24.5547 0.001 -24.6969 -24.4125   True
 First Quarter  Third Quarter -59.9454 0.001 -60.0939  -59.797   True
  Last Quarter Second Quarter  62.5818 0.001  62.4395  62.7241   True
  Last Quarter  Third Quarter  27.1911 0.001  27.0424  27.3397   True
Second Quarter  Third Quarter -35.3907 0.001 -35.5365 -35.2449   True
---------------------------------------------------------------------
ANOVA 的结果只能说明 there is a significant difference among the groups,但无法得知具体是哪些组之间存在difference.
tukeyhsd 可以把4个组 进行两两比较,以便于找出哪两个组之间的difference比较大。
从 tukeyhsd 的结果可以看出,任意两组之间的 meandiff 都比较大,都reject了Null Hypothesis and alternative hypothesis is supported.
疑问:既然从 box plot 上就可以清晰地看出来每组的 mean value diff 非常大,为什么还需要做 ANOVA 呢?
参考资料: